Where to Get Outside This Fall: The 2026 Rankings

Fall travel is often sold with the same promise of colorful leaves, but the best fall destinations offer more than a good view. Trimi analyzed 60 popular U.S. fall destinations across 12 measures, including foliage, weather, trails, walkability, air quality, and access to outdoor recreation. The result is a 0–100 Healthy Fall Score showing which places make it easiest to get outside and enjoy the season.
Using data from the U.S. Census, EPA, NOAA, OpenStreetMap, and other sources, the rankings reveal the best overall destinations for fall 2026, along with standout picks for hikers, walkers, late-season travelers, and anyone looking for a hidden gem getaway.
Key Takeaways
- Boston, Washington, DC, and New York City are the best fall destinations to get outside in 2026.
- Sturgeon Bay, WI; Harpers Ferry, WV; and Estes Park, CO rank at the bottom among the 60 destinations analyzed.
- Park City, UT, has the most trail miles of any fall destination, 1,288 within 15 miles, while Camden, ME, has the cleanest fall air, with good-AQI days on 97.5% of days from 2023–2025.
- Boston tops the walkability rankings among fall destinations, while Telluride, CO, has the longest crisp-weather window at nearly 10 weeks (69 days of 45°–70°F highs).
- Telluride is also the most car-free fall destination in America: 53% of workers there walk or bike to work, the only place in the study above 50%.
- The most underrated fall destination in America is Marquette, MI, a top-10 finisher that draws fewer than 5,000 “things to do” searches a month (20 times fewer than No. 1 Boston).
- Major metros make up just six of the top 25. The other 19 are small cities and towns, 13 of them home to fewer than 50,000 people.
Boston, DC, and New York Take the Top 3 Spots
Big cities dominate the top of the rankings, but they are far from the only places that stand out. Boston leads the study with a strong mix of crisp fall weather, trail access, and walkability, while smaller destinations like Salem, Boone, and Marquette also break into the top 10.
How 60 top fall destinations match up when comparing foliage, fitness, wellness, and weather in 2026
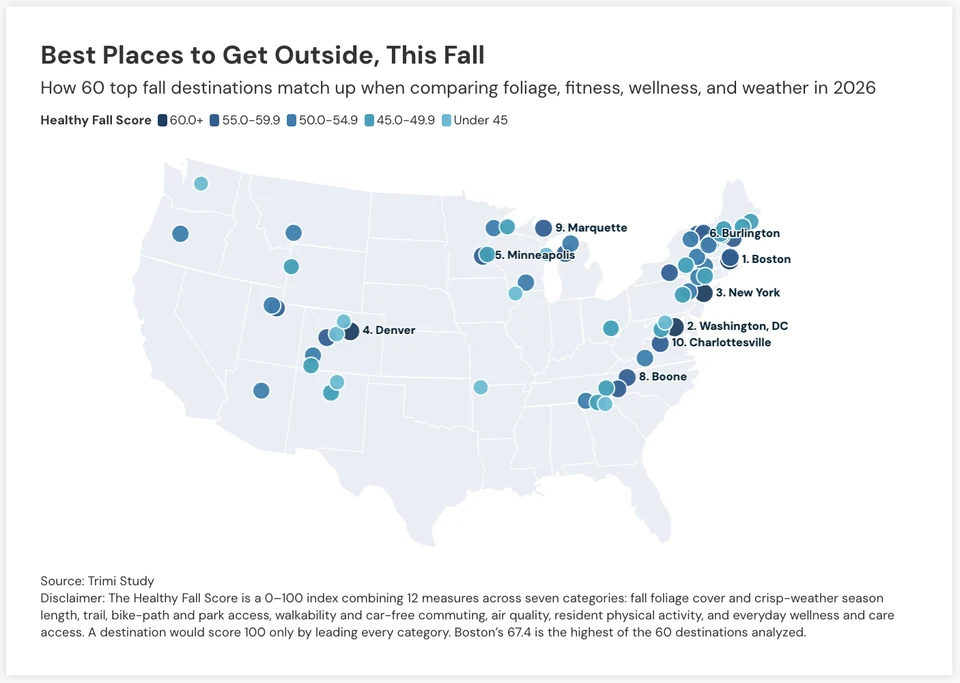
The Healthy Fall Score is a 0–100 index combining 12 measures across seven categories: fall foliage cover and crisp-weather season length, trail, bike-path and park access, walkability and car-free commuting, air quality, resident physical activity, and everyday wellness and care access. A destination would score 100 only by leading every category. Boston's 67.4 is the highest of the 60 destinations analyzed.
| Rank | Destination | Healthy Fall Score | Forest cover % | Crisp fall days | Trail miles (15 mi) | Wellness businesses | % adults active | % good air days |
|---|---|---|---|---|---|---|---|---|
| 1 | Boston, MA | 67.4 | 15.8 | 68 | 975 | 764 | 76.8 | 73.1 |
| 2 | Washington, DC | 64.6 | 25.2 | 47 | 660 | 968 | 84.7 | 60.5 |
| 3 | New York, NY | 62.5 | 2.9 | 60 | 196 | 2,446 | 71.9 | 56.4 |
| 4 | Denver, CO | 61.9 | 0 | 54 | 924 | 1,318 | 82.7 | 40.5 |
| 5 | Minneapolis, MN | 59.8 | 7.2 | 49 | 501 | 623 | 79.6 | 57.2 |
| 6 | Burlington, VT | 57.5 | 40.8 | 58 | 475 | 95 | 84.5 | 82.3 |
| 7 | Salem, MA | 57.2 | 17.9 | 68 | 871 | 68 | 77.6 | 76.6 |
| 8 | Boone, NC | 56.9 | 75.8 | 68 | 233 | 66 | 77 | 89.8 |
| 9 | Marquette, MI | 56.8 | 55.9 | 57 | 383 | 51 | 78.1 | 85.7 |
| 10 | Charlottesville, VA | 56.8 | 58.9 | 59 | 294 | 209 | 77.7 | 76.5 |
| 11 | Aspen, CO | 55.9 | 19 | 65 | 551 | 90 | 87 | 94.6 |
| 12 | Asheville, NC | 55.9 | 63.1 | 47 | 275 | 382 | 80 | 70.7 |
| 13 | Traverse City, MI | 55.7 | 35.8 | 56 | 400 | 143 | 77.5 | 87.4 |
| 14 | Park City, UT | 55.6 | 41.5 | 51 | 1,288 | 136 | 85.4 | 73 |
| 15 | Stowe, VT | 55.6 | 65.5 | 58 | 506 | 29 | 84.2 | 82.3 |
| 16 | Portland, ME | 55.5 | 30.8 | 67 | 490 | 161 | 82.9 | 75.5 |
| 17 | Ithaca, NY | 55.0 | 46.3 | 61 | 230 | 118 | 82.6 | 94.4 |
| 18 | Hanover, NH | 54.2 | 55.8 | 57 | 656 | 9 | 86.5 | 86.7 |
| 19 | Roanoke, VA | 54.2 | 61.8 | 45 | 253 | 184 | 70.2 | 78.7 |
| 20 | Salt Lake City, UT | 53.7 | 18.4 | 51 | 621 | 539 | 81.6 | 38.3 |
| 21 | Petoskey, MI | 53.7 | 48.6 | 60 | 395 | 54 | 80.8 | 78.5 |
| 22 | Madison, WI | 53.5 | 12.9 | 52 | 272 | 433 | 78 | 63.3 |
| 23 | Stroudsburg, PA | 53.1 | 60.1 | 63 | 333 | 49 | 74.8 | 90.4 |
| 24 | Bend, OR | 52.9 | 0 | 55 | 700 | 326 | 84.7 | 78.2 |
| 25 | Duluth, MN | 52.8 | 38.9 | 53 | 199 | 111 | 77 | 68.4 |
| 26 | Lenox, MA | 52.7 | 69 | 62 | 434 | 18 | 77.4 | 76.8 |
| 27 | Saratoga Springs, NY | 52.2 | 34.6 | 57 | 243 | 119 | 81.8 | 96.3 |
| 28 | Bozeman, MT | 51.8 | 0.5 | 51 | 375 | 180 | 86.5 | 93 |
| 29 | New Paltz, NY | 51.6 | 53.9 | 63 | 152 | 36 | 78.5 | 82.6 |
| 30 | North Conway, NH | 51.3 | 61.6 | 58 | 549 | 36 | 78.9 | 83.3 |
| 31 | Telluride, CO | 51.2 | 20.9 | 69 | 429 | 43 | 87.9 | 81.6 |
| 32 | Chattanooga, TN | 51.1 | 50.2 | 35 | 481 | 325 | 75.1 | 55.8 |
| 33 | Woodstock, VT | 51.0 | 59.4 | 57 | 452 | 15 | 82.1 | 76.9 |
| 34 | Flagstaff, AZ | 50.5 | 0.8 | 63 | 745 | 156 | 85 | 68.3 |
| 35 | Lake Placid, NY | 50.1 | 47.7 | 58 | 655 | 24 | 77.4 | 83.2 |
| 36 | Santa Fe, NM | 49.7 | 0.5 | 57 | 640 | 253 | 78.6 | 76.1 |
| 37 | Kent, CT | 49.3 | 65.9 | 63 | 335 | 9 | 76.6 | 81.3 |
| 38 | Jackson, NH | 48.9 | 59.1 | 58 | 684 | 7 | 79.5 | 83.3 |
| 39 | Jim Thorpe, PA | 48.7 | 61.9 | 57 | 392 | 10 | 76.7 | 70.3 |
| 40 | Logan, OH | 48.3 | 70.7 | 58 | 127 | 21 | 64.8 | 86.6 |
| 41 | Stillwater, MN | 47.8 | 18.7 | 47 | 259 | 63 | 81.4 | 91.3 |
| 42 | Cooperstown, NY | 47.8 | 49.8 | 62 | 34 | 7 | 79 | 82.9 |
| 43 | Gatlinburg, TN | 47.7 | 72.1 | 50 | 275 | 36 | 74.7 | 85.1 |
| 44 | Bar Harbor, ME | 47.6 | 32.5 | 66 | 181 | 25 | 82 | 89.4 |
| 45 | Bethel, ME | 47.5 | 65.8 | 57 | 257 | 10 | 77.7 | 82.1 |
| 46 | Camden, ME | 47.4 | 49 | 68 | 76 | 13 | 79.5 | 97.5 |
| 47 | Blue Ridge, GA | 47.2 | 73.5 | 44 | 208 | 39 | 68.3 | 86 |
| 48 | Front Royal, VA | 47.1 | 57.2 | 58 | 242 | 22 | 71.8 | 71.5 |
| 49 | Durango, CO | 46.9 | 20.1 | 56 | 372 | 108 | 85.4 | 64 |
| 50 | Jackson, WY | 45.6 | 1.4 | 48 | 810 | 70 | 82.5 | 82.8 |
| 51 | Bayfield, WI | 45.2 | 68.4 | 56 | 38 | 4 | 68.7 | 82.4 |
| 52 | Breckenridge, CO | 43.5 | 4.4 | 50 | 814 | 49 | 85.7 | 81.8 |
| 53 | Taos, NM | 41.9 | 3.4 | 53 | 274 | 52 | 73.9 | 96.9 |
| 54 | Eureka Springs, AR | 41.2 | 57.1 | 46 | 62 | 28 | 66.8 | 79.7 |
| 55 | Helen, GA | 40.8 | 73.8 | 44 | 135 | 6 | 76.1 | 50.5 |
| 56 | Galena, IL | 39.9 | 23.6 | 51 | 82 | 13 | 78.9 | 91.5 |
| 57 | Leavenworth, WA | 39.6 | 0.4 | 40 | 632 | 32 | 83.7 | 75.5 |
| 58 | Estes Park, CO | 39.2 | 0.5 | 59 | 749 | 31 | 85.1 | 47.1 |
| 59 | Harpers Ferry, WV | 39.2 | 32.1 | 48 | 195 | 5 | 74 | 78.9 |
| 60 | Sturgeon Bay, WI | 36.7 | 9.4 | 57 | 37 | 28 | 71.8 | 82.8 |
The Healthy Fall Score is a 0–100 index combining 12 measures across seven categories: fall foliage cover and crisp-weather season length, trail, bike-path and park access, walkability and car-free commuting, air quality, resident physical activity, and everyday wellness and care access. A destination would score 100 only by leading every category. Boston's 67.4 is the highest of the 60 destinations analyzed.
- Boston earns the top score in the study (67.4 of 100), pairing 68 crisp fall days with 975 trail-path miles, and the highest walkability score of any destination measured.
- Washington, DC, ranks second (64.6), New York City third (62.5), and Denver fourth (61.9), the only four destinations to clear 60 points.
- Major metros claim the entire top 5 fall destinations, yet just six of the top 25 are cities of more than 250,000 people.
- 13 of the top 25 are towns of fewer than 50,000, led by Salem, MA (No. 7) and Boone, NC (No. 8).
- Denver holds its No. 4 spot, with almost no nearby fall forest cover. What carries the city is pure outdoor access: 924 trail miles and 801 bike-path miles, the third- and second-most in the study.
- The most underrated destination is Marquette, MI., which lands at No. 9 with 56% fall forest cover and good air on 86% of days, yet draws under 5,000 monthly “things to do” searches, about 20 times fewer than Boston's 94,083.
- Sturgeon Bay, WI, finishes last of the 60 destinations at 36.7, with Harpers Ferry, WV (39.2), and Estes Park, CO (39.2), close behind at Nos. 59 and 58. Thin forest cover weighs down all three, and Sturgeon Bay also has one of the smallest trail networks in the study, at 37 mapped miles.
The destinations that lead each of the study's core outdoor categories
| Category | What it measures | No. 1 | No. 2 | No. 3 |
|---|---|---|---|---|
| Most fall color | Fall forest cover within 15 miles | Boone, NC — 75.8% | Helen, GA — 73.8% | Blue Ridge, GA — 73.5% |
| Longest crisp season | Days with 45°–70°F normal highs Sept.–Nov. | Telluride, CO — 69 days | Boston, MA — 68 | Salem, MA / Boone, NC — 68 |
| Most trail miles | Mapped trail-path miles within 15 miles | Park City, UT — 1,288 mi. | Boston, MA — 975 | Denver, CO — 924 |
| Most bike-path miles | Mapped cycleway miles within 15 miles | Minneapolis, MN — 1,905 mi. | Denver, CO — 801 | Stillwater, MN — 724 |
| Most parks in reach | Mapped parks within 15 miles | New York, NY — 2,537 | Washington, DC — 2,166 | Boston, MA — 1,748 |
| Top car-free commuters | Share of workers walking or biking to work | Telluride, CO — 53.2% | Stowe, VT — 42.3% | Cooperstown, NY — 40.7% |
| Cleanest fall air | Good-AQI days 2023–2025 | Camden, ME — 97.5% | Taos, NM — 96.9% | Saratoga Springs, NY — 96.3% |
| Biggest wellness scene | Fitness, healthy food, spa & market businesses in the city | New York, NY — 2,446 | Denver, CO — 1,318 | Washington, DC — 968 |
- Park City, UT, has the most trail miles in the study, 1,288 within 15 miles, more than Boston's 975 and Denver's 924, and about 35x Sturgeon Bay's 37.
- Camden, ME, has the cleanest fall air of the 60 destinations, with good-AQI days on 97.5% of days from 2023–2025, while Salt Lake City has the fewest at 38.3%.
- Telluride logs the longest crisp season in the study at 69 days of 45°–70°F highs, one day more than Boston, Salem, and Boone, which tie at 68.
- In Telluride, a majority of workers (53.2%) walk or bike to work, the only destination in the study above 50% and well ahead of third-place Cooperstown, NY (40.7%).
- New York has more mapped parks within reach than anywhere else in the study (2,537), ahead of Washington, DC (2,166), and Boston (1,748), proof that a big-city fall can still mean plenty of green space.
There's a Fall Pick for Every Kind of Traveler
The index also breaks into picks for every kind of fall traveler, from summit chasers to city walkers to late planners.
Whether you want 1,288 miles of trail or a town you can cross on foot, there's a destination for it
| Pick | Why it wins |
|---|---|
| Park City, UT | 1,288 mapped trail miles within 15 miles — the largest network in the study |
| Boston, MA | 975 trail miles |
| Denver, CO | 924 trail miles |
| Salem, MA | 871 trail miles |
| Breckenridge, CO | 814 trail miles |
| Pick | Why it wins |
|---|---|
| Telluride, CO | 53% of workers walk or bike to work — the only destination above 50% |
| Stowe, VT | 42% walk or bike to work |
| Cooperstown, NY | 41% walk or bike to work |
| Boston, MA | Top big-city EPA walkability (15.4) |
| Minneapolis, MN | 15.1 EPA walkability |
| Pick | Why it wins |
|---|---|
| Washington, DC | Crisp 45°–70°F days through Nov. 30 |
| New York, NY | Crisp days Oct. 2–Nov. 30 |
| Boone, NC | Crisp days Sept. 24–Nov. 30 |
| Charlottesville, VA | Crisp days Oct. 3–Nov. 30 |
| Asheville, NC / Roanoke, VA / Stroudsburg, PA | Crisp windows run through Nov. 30 |
| Pick | Why it wins |
|---|---|
| Marquette, MI | No. 9 overall on a fraction of the search interest (~4,600 monthly searches) |
| Aspen, CO | No. 11 overall |
| Stowe, VT / Portland, ME | No. 15 / No. 16 overall |
| Ithaca, NY / Hanover, NH | No. 17 / No. 18 overall |
| Petoskey, MI / Stroudsburg, PA / Bend, OR | No. 21 / No. 23 / No. 24 overall |
- Serious hikers have Park City's 1,288 trail miles to work with, while easy walkers in Telluride and Stowe find 42% to 53% of locals already commuting on foot or by bike.
- Late planners have until Thanksgiving: Washington, DC, New York City, Boone, Charlottesville, Asheville, Roanoke, and Stroudsburg all keep crisp 45°–70°F days through Nov. 30.
- North Carolina's Boone is the ultimate late-season leaf town, with the highest forest cover in the study (76%), 68 crisp days, and a season that runs Sept. 24 through Nov. 30.
What Health-Conscious Travelers Can Look for in a Fall Destination
A great fall trip doesn't have to revolve around strenuous hikes or packed itineraries. For travelers who want to stay active and feel good while they are away, a few destination features can make spending time outside easier.
- Start with air quality and weather. Places with more good-AQI days and longer stretches of mild temperatures may offer more opportunities to comfortably walk or explore outdoors. Camden, Maine, had the highest share of good-AQI days in the study, while Telluride, Colorado, had the longest stretch of crisp weather.
- Then consider how easy it is to move around once you arrive. Walkable streets, nearby parks, bike paths, and accessible trail networks can make physical activity part of the day without requiring a dedicated workout. Boston, for example, combines the highest walkability score in the study with hundreds of miles of nearby trails.
- Look at practical amenities, including healthy food options, fitness facilities, and access to medical care. No single measure determines whether a destination is “healthy,” but together they can help travelers choose a place that makes it easier to maintain the routines that matter to them.
Because air quality can change from day to day, travelers should also check the current AQI and local weather forecast before heading outside.
Methodology
To determine where fall is best spent outdoors, we scored 60 recognized U.S. fall destinations (a curated mix of iconic leaf-peeping towns and major metros with strong foliage reputations across all regions) on 12 measures grouped into seven weighted categories (weights sum to 100):
- Fall color and season length (25 points): share of land within 15 miles covered by deciduous or mixed forest (USGS/MRLC National Land Cover Database 2021) at 12.5, and “crisp fall days,” meaning days with normal highs of 45°–70°F from Sept. 1 to Nov. 30 (NOAA 1991–2020 climate normals, nearest station), at 12.5.
- Trails, parks, and outdoor recreation (25 points): mapped trail-path miles (12.5), bike-path miles (6.25), and parks (6.25) within 15 miles of the destination center (OpenStreetMap, August 2026).
- Everyday wellness amenities (10 points): unique fitness studios, healthy-food businesses, spas/saunas/massage, and farmers markets listed in the destination city (Yelp Fusion API, August 2026).
- Walkability and active commuting (10 points): average EPA National Walkability Index of the destination core (5) and the share of workers commuting by foot or bike (U.S. Census ACS 2019–23, 5).
- Air quality (10 points): share of good-AQI days (5) and median AQI, inverted (5), pooled 2023–25 (EPA AirData annual county AQI; nearest monitored county where the destination's county has no monitor).
- Resident physical activity (10 points): share of adults not reporting zero leisure-time physical activity (CDC PLACES 2025 release).
- Preventive and primary care access (10 points): unique physicians, family medicine, urgent/medical centers, and preventive-health providers listed in the destination city (Yelp Fusion API).
Scoring follows a standard meta-ranking approach: each measure is scaled by dividing by (category maximum ÷ weight), and scaled scores are summed to a 0–100 score. Quantity measures (miles and business/park counts) are square-root transformed before scaling to reflect diminishing returns, so a destination with four times the businesses earns twice the points, preventing sheer city size from dominating; percentage, index, and day-count measures are scaled linearly. Median AQI is inverted, so cleaner air scores higher.
Notes and limitations: Rankings describe only the 60 destinations analyzed. Yelp counts reflect businesses listed in the destination city proper (New York includes the five boroughs), and the API caps detailed results at 240 per query; duplicates across categories were removed. OpenStreetMap trail data reflects community-mapped infrastructure and replaced AllTrails, whose terms prohibit automated collection. Air-quality data is published at the county level; nine destinations in unmonitored counties use the nearest monitored county. Pennsylvania destinations use the CDC PLACES 2024 release (2022 BRFSS) because Pennsylvania did not field the 2023 BRFSS; Jackson, N.H., and Kent, Conn., use their county/planning-region values. Commuting shares for very small towns carry wide margins of error. Crisp-day windows ending Nov. 30 extend beyond the study period. Full data, sources, and the weight-adjustable scoring model are available on request.
Search volume figures come from Google Ads monthly search data accessed via DataForSEO, measured U.S.-nationally and averaged across August 2025 through July 2026 for the query “things to do in [city].” These figures inform the “most underrated” callouts only and are not an input to the Healthy Fall Score.
Medical Disclaimer
This content is for informational purposes only and does not constitute medical advice. Always consult a qualified healthcare provider before starting, adjusting, or discontinuing any medication. Individual results vary. GLP-1 medications require a prescription and should only be used under medical supervision.
About Trimi
Trimi is a U.S. telehealth provider that connects patients with licensed providers and named 503A compounding pharmacies for GLP-1 treatment, including compounded semaglutide and compounded tirzepatide, with transparent all-in pricing and no membership fees. That vantage point gives the company a close view of the cost, access, and everyday decisions behind the GLP-1 conversation. (Trimi, at trytrimi.com, is a separate company from the similarly named TrimRx.)
Fair Use Statement
Feel free to share the findings from this study for any noncommercial use. We only ask that you link back to the full study so readers can see the complete results and methodology, and please credit Trimi as the source.